Market Update March 2016
March 11, 2016, by Mark Wheeler
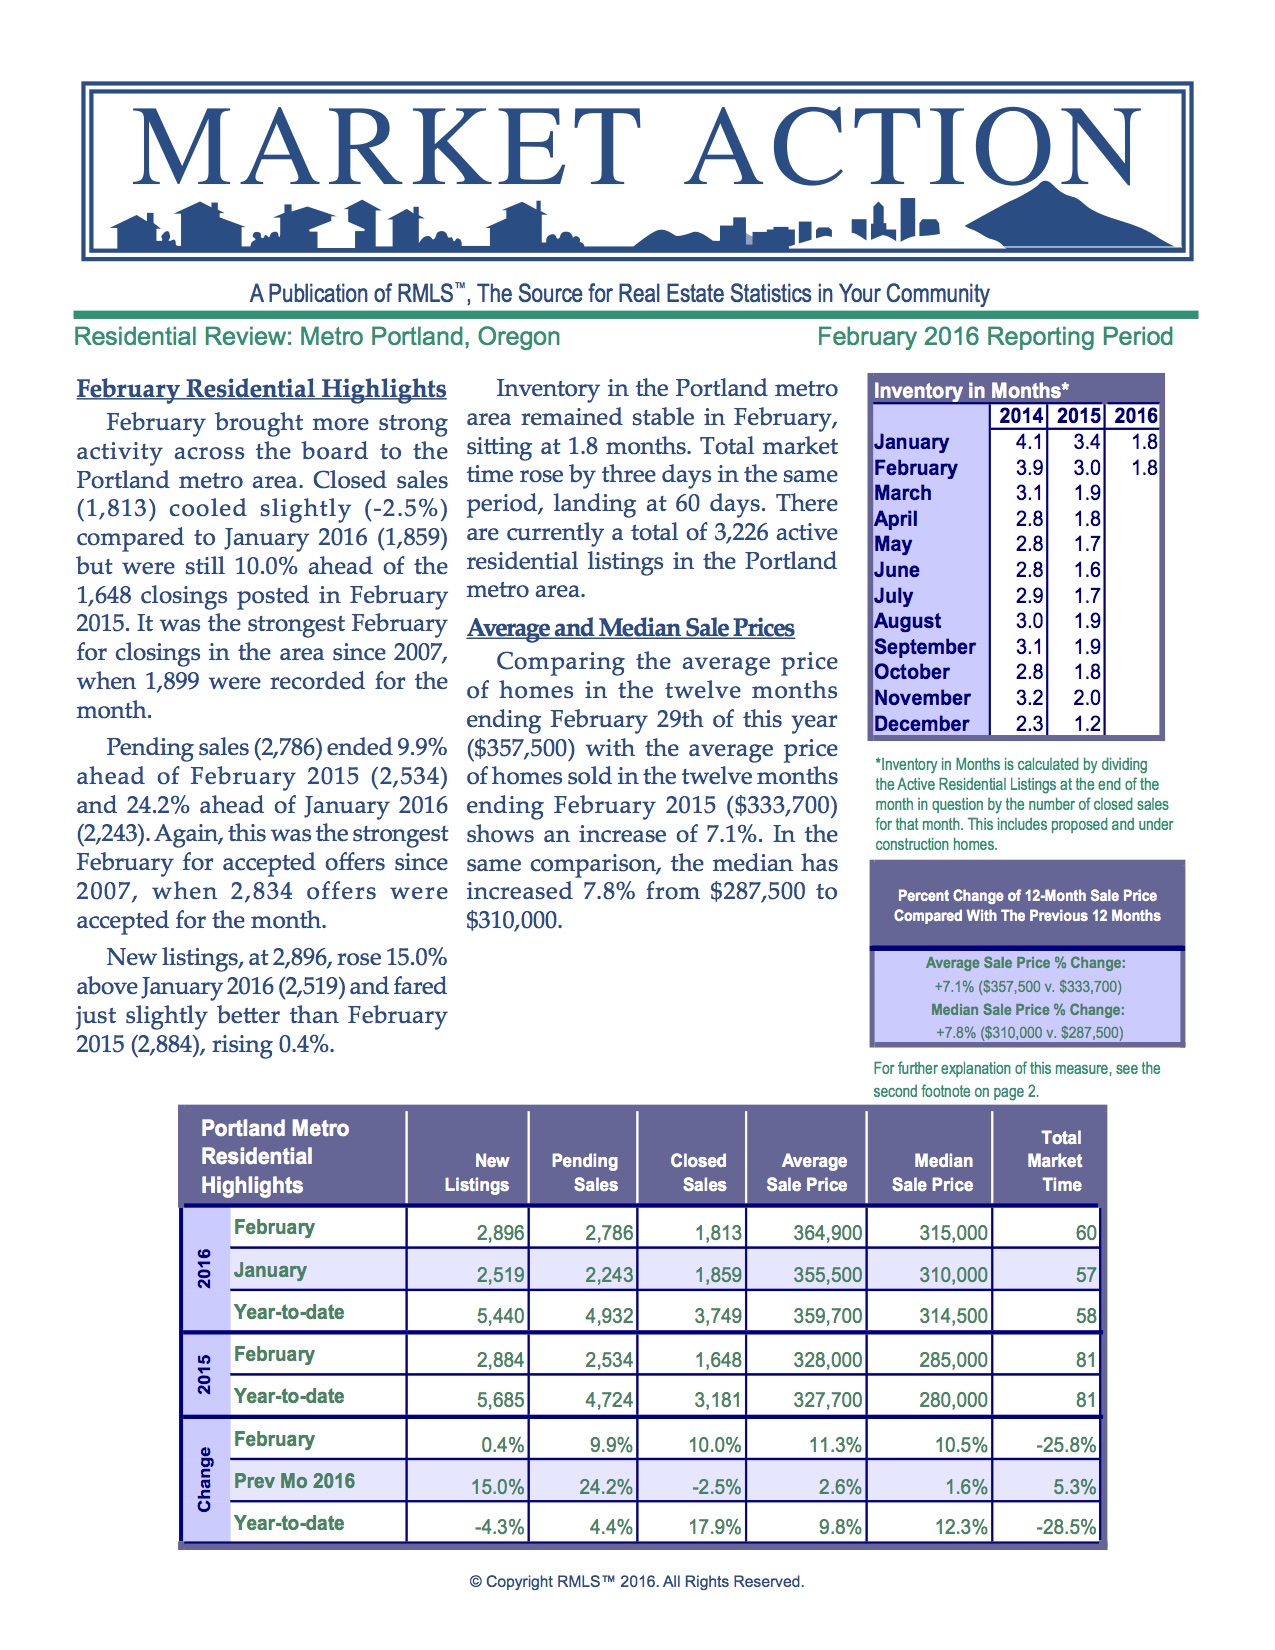
The latest monthly Market Action Report from RMLS is out. RMLS is the Portland Metro Area’s Regional Multiple Listing Service, where virtually all houses for sale in this area are listed. Since we have some pretty significant numbers in this report I’d like to show you a couple of highlights from that, along with what’s happening when we look closer at smaller geographic areas in the popular parts of Portland. Unfortunately (except if you are a seller) we are still in a period of low inventory, multiple offers & frazzled buyers.
From the February 2016 Market Action: “Comparing the average price of homes in the twelve months ending February 29th of this year ($357,500) with the average price of homes sold in the twelve months ending February 2015 ($333,700) shows an increase of 7.1%. In the same comparison, the median has increased 7.8% from $287,500 to $310,000. Inventory in the Portland metro area remained stable in February, sitting at 1.8 months.”
Obviously this compares apples to oranges, not apples to apples (the houses sold February 2015 are for the most part not the same houses that sold in February 2016), so let’s look a bit further.
The 1.8 months of inventory refers to the Absorption Rate* for the entire Portland Metro Area, and includes properties that are not attractive for whatever reasons, so they do not sell quickly & they tend to skew the averages. When you get into the more popular areas, available inventory is even less.
Right now in Zipcodes 97214 & 97202, which includes a large part of the popular SE Portland neighborhoods**, there are 50 detached houses for sale. In the last 30 days, 40 houses have sold in this area. This means there is currently 1.25 months of inventory, or about 5 weeks.
If we ignore 4 of those properties that were under construction so those buyers were not able to close those sales quickly, we have median days on the market at 5 days, median list price at $477,450, & median sold price at $516,750, or 108% of list price.
This is a very hot market, and a tough time for buyers. Most buyers can expect to write a few offers & miss out on a few houses before finally being able to buy one they like. Houses are still being bought though, it just takes perseverance & probably some compromising by most buyers.
*Absorption rate is a way to track how many real estate listings are on the market versus how many listings are selling within any given period of time. It looks at monthly inventory; in other words, how many months would it take for all of the available listings to sell, if no new listings entered the market. Of course this is hypothetical, but it can be a revealing statistic that helps to identify trends. About 6 months of available housing inventory is typically considered “balanced,” neither a strong buyers’ market nor a strong sellers’ market. Both are approximately equal at about 6 months of inventory. Under 6 months points to a sellers’ advantage in the market, over 6 months indicates buyer advantage.
** These neighborhoods include Sellwood, Moreland, West Moreland, East Moreland, Brooklyn, Ladds Addition, Sunnyside, Richmond, Hosford Abernathy, Creston – Kenilworth, Reed, Buckman, Hawthorne & Belmont.

Follow Us